Note
Access to this page requires authorization. You can try signing in or changing directories.
Access to this page requires authorization. You can try changing directories.
By Mark Russinovich
Published: March 26, 2026
 Download DebugView (1012 KB)
Run now from Sysinternals Live.
Introduction
DebugView is an application that lets you monitor debug output on your local system, or any computer on the network that you can reach via TCP/IP. It is capable of displaying both kernel-mode and Win32 debug output, so you don't need a debugger to catch the debug output your applications or device drivers generate, nor do you need to modify your applications or drivers to use non-standard debug output APIs.
Note
DebugView v5.0 requires Windows 10 version 1809 (build 17763) / Windows Server 2019 or later.
DebugView Capture
DebugView will capture:
- Win32 OutputDebugString
- Kernel-mode DbgPrint
- All kernel-mode variants of DbgPrint
DebugView also extracts kernel-mode debug output generated before a crash from Windows crash dump files if DebugView was capturing at the time of the crash.
DebugView Capabilities
DebugView has a powerful array of features for controlling and managing debug output.
Features new to version 5.0:
- Dark mode and modern UI: DebugView now features a completely redesigned interface using Windows XAML Islands technology. The UI automatically follows the system-wide light or dark theme setting, with dark mode applied consistently to the title bar, menus, toolbar, dialogs, and the output list view. The modernized toolbar and menu bar provide a visual style consistent with other Sysinternals tools such as Process Monitor.
- Automatic crash recovery: When DebugView detects that the previous session ended due to an ungraceful shutdown (such as a system crash), it automatically scans the Windows crash dump file, recovers pending kernel debug traces from the previous session, and displays them in the output window. This enables post-mortem analysis of kernel-mode debug output that was captured right up to the moment of a system failure, without any manual intervention.
- UI virtualization for large captures: The output list view now uses owner-data virtualization, which means only the visible rows are rendered at any time. This allows DebugView to efficiently handle captures containing hundreds of thousands or millions of debug messages without excessive memory consumption or UI slowdown.
- Dedicated PID column: A new Process ID column is displayed by default, making it easier to identify which process generated each debug output message. The PID column can be toggled on or off from the Options menu.
- On-demand UAC elevation: DebugView no longer requires administrative privileges at launch. It starts as a standard user and requests elevation via a UAC prompt only when you enable kernel-mode capture or other operations that require elevated privileges.
- DPI-aware rendering: Menu icons, toolbar buttons, dialogs, and the output list all scale correctly on high-DPI displays.
Features new to version 4.6:
- Support for Windows Vista 32-bit and 64-bit
Features new to version 4.5:
- Support for log-file rollover: To better support long-running captures, DebugView can now create a new log file each day, optionally clearing the display when doing so.
Features new to version 4.4:
- Support for Windows Server 2003 64-bit Edition and Windows XP 64-bit Edition for x64:DebugView now captures kernel-mode debug output on 64-bit versions of Windows.
- Clock-time toggle: you can now toggle between clock time and elapsed time modes.
Features new to version 4.3:
- Support for Windows XP SP2:DebugView now captures kernel-mode debug output on Windows XP SP2.
- More highlighting filters: Many people have asked for more highlighting filters.
- Log file wrapping: A new log file option has DebugView wrap around to the start of the log file when the specified size limit is reached.
- Larger buffers: Larger Win32 and kernel-mode buffers lessen the chance of dropped debug output.
- Clear-output string: When DebugView sees the special debug output string "DBGVIEWCLEAR" it clears the output.
- Client minimize-to-tray: You can now run the client minimized in the tray.
Features new to version 4.2:
- Kernel-hook bug fixed:DebugView sometimes mistakenly report that it couldn't hook kernel-mode debug output on Windows XP and Server 2003.
- Client global-capture option: A new option allows the client to capture console Win32 debug output on Terminal Server systems when run from a non-console session.
- Filtering improved: Filters can be much longer and now apply to Win32 process IDs when process IDs are included in the output.
- Crash-dump support improved: Several bugs related to extracting kernel-mode output from crash dumps are fixed and DebugView now loads resulting log files.
- More highlight filters:DebugView now has 10 highlight filters, up from 5.
- Insert comments: A new menu item lets you insert comments into output.
- New switches: New command-line switches allow you to specify history depth and load log files.
- Better balloon tips: If an output line is wider than the screen its mouse hover balloon tip word wraps.
Features new to version 4.1:
- Save and load filters: You can save and load filters, including the highlighting colors.
- Load saved logs: You can now load a log file back into the DebugView output window.
- Capture boot-time kernel-mode debug output: Under Windows 2000, you can use DebugView to capture debug output generated by drivers from the earliest point in the boot process.
Here is a list highlighting some of DebugView's other features:
- Remote monitoring: Capture kernel-mode and/or Win32 debug output from any computer accessible via TCP/IP - even across the Internet. You can monitor multiple remote computers simultaneously. DebugView will even install its client software itself if you are running it on a Windows 2000 system and are capturing from another Windows 2000 system in the same Network Neighborhood.
- Most-recent-filter lists:DebugView remembers your most recent filter selections, with an interface that makes it easy to reselect them.
- Dedicated PID column: A separate Process ID column shows which process generated each debug message, toggleable from the Options menu.
- Clipboard copy: Select multiple lines in the output window and copy their contents to the clipboard.
- Log-to-file: Write debug output to a file as its being captured.
- Printing: Print all or part of captured debug output to a printer.
- One-file payload:DebugView is implemented as one file.
- Crash-Dump Support:DebugView can recover its buffers from a crash dump and save the output to a log file so that users can send you the output your Windows driver generated right up to the time of a crash. In version 5.0, this recovery is performed automatically on startup when an ungraceful shutdown is detected.
The on-line help file describes all these features, and more, in detail.
System Requirements
DebugView v5.0 requires Windows 10 version 1809 (build 17763) or Windows Server 2019 or later. The modern UI is built on Windows XAML Islands, which requires this minimum OS version. Users on older versions of Windows should use DebugView v4.90.
Installation and Use
Simply execute the DebugView program file (dbgview.exe) and DebugView will immediately start capturing debug output. DebugView starts as a standard user; you will be prompted for elevation via UAC only when you enable kernel-mode capture or other operations that require administrative privileges. Menus, hot-keys, or toolbar buttons can be used to clear the window, save the monitored data to a file, search output, change the window font, and more. The on-line help describes all of DebugView's features.
If a previous DebugView session was active during a system crash, DebugView will automatically detect the ungraceful shutdown on the next launch, scan the crash dump file, and display any recovered kernel debug traces from the prior session.
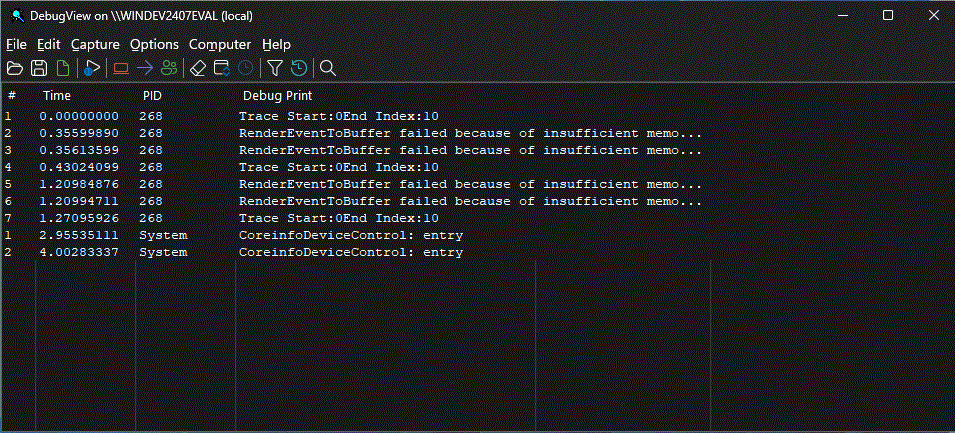
This is a screenshot of DebugView capturing debug output. Note the modern dark mode interface with the dedicated PID column and highlighting filter.
Download DebugView (1012 KB)
Run now from Sysinternals Live.