Note
Access to this page requires authorization. You can try signing in or changing directories.
Access to this page requires authorization. You can try changing directories.
Azure DevOps Services | Azure DevOps Server | Azure DevOps Server 2022
Throughout your sprint, monitor the sprint burndown report to determine if your team is on track to complete its sprint plan. Two burndown charts are available:
- In-context Burndown Trend report: Viewable from a team's sprint backlog Analytics tab.
- Sprint Burndown widget: Add to any dashboard from the widget catalog.
Both charts derive data from Analytics and support burndown based on a count of work items or a sum of Story Points, Effort, Remaining Work, or other numeric fields. For more configuration options, see Configure a burndown or burnup widget. For an overview of all burndown chart types, see Burndown and burnup guidance.
Tip
You can use AI to help with this task later in this article, or see Enable AI assistance with Azure DevOps MCP Server to get started.
Prerequisites
| Category | Requirements |
|---|---|
| Access levels | - Project member. - At least Basic access. |
| Permissions | - Team administrator or project administrator or specific dashboard permissions granted to you. - To add a widget to a team dashboard: Member of the team. |
| Feature enablement | Azure Boards enabled. If disabled, none of the work-tracking Analytics widgets are displayed. To re-enable it, see Turn a service on or off. |
| Task awareness | Awareness of any required or recommended tasks listed later in this article. |
| Category | Requirements |
|---|---|
| Access levels | - Project member. - At least Basic access. |
| Permissions | - Team administrator or project administrator or specific dashboard permissions granted to you. - To add a widget to a team dashboard: Member of the team. |
| Feature enablement | - Azure Boards enabled. If disabled, none of the work-tracking Analytics widgets are displayed. To re-enable it, see Turn a service on or off. - Analytics installed and enabled. Members of the Project Collection Administrators group can add extensions or enable the service. Organization owners are automatically members of this group. |
To monitor sprint burndown, your team must schedule sprints and assign work to those sprints. If you want to burn down on Remaining Work, you must also:
- Define and estimate tasks for each backlog item in the sprint.
- Update Remaining Work for each task as work progresses.
Important
Deleting Area Path values or reconfiguring Iteration Path values causes irreversible data loss in the following charts:
- Burndown and burn up widget charts
- Sprint burndown charts
- Velocity charts for teams with changed area paths
- Historical trend charts that reference the Area Path and Iteration Path values as defined at the time for each work item
You can delete area and iteration paths only when they're no longer used by any work items. When you delete these paths, you can no longer retrieve their historical data.
Understand sprint burndown chart elements
The in-context report and the Sprint Burndown widget display the same chart elements. The header metric label (for example, Stories Remaining or Tasks Remaining) changes based on the work item type you select.

| Element | Description |
|---|---|
| Date range | The start and end date of the sprint. |
| Items Remaining | The number of work items remaining in the sprint. The label changes based on your work item type selection. |
| Completed | The percentage of work completed based on original scope. Select Completed to see the full list of completed work items. |
| Average burndown | Average work completed per day or interval. |
| Total Scope Increase | The change in work from the original scope since the burndown started. |
| Remaining | The number of work items still active or in progress. |
| Total Scope | The total number of work items in the sprint including closed items. Scope decreases when an item's Iteration Path changes to another sprint, or when items are completed. |
| Ideal Trend | The ideal burndown rate calculated from the number of work items, days in the sprint, and working days. |
Because individual team members might only update their work items once a week or every few days, there's usually a staircase burndown pattern.
Open the in-context Burndown Trend report
Go to Boards > Sprints, select your team, and then select Backlog.
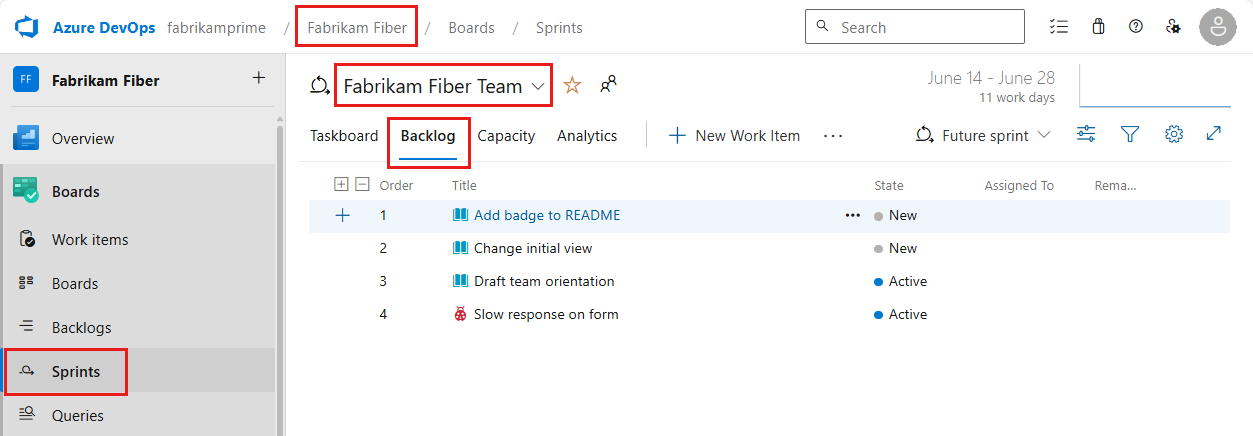
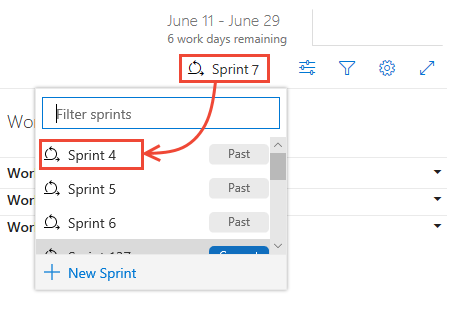
To view a different sprint, open the sprint selector and select the sprint you want.

If you don't see the sprint you want, select New Sprint > Select existing iteration. For more information, see Define iteration paths.
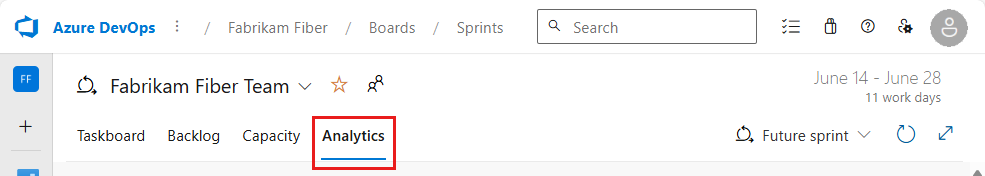
Select the Analytics tab.
Use the interactive controls to configure the report:
- Start Date and End Date: Default to the current sprint dates.
- Backlogs/Work Items: Select a product backlog (Stories, Issues, Product Backlog Items, or Requirements) or the Tasks backlog. Your selection determines the available Burndown on options.
- Burndown on: Select Count of Work Items or a sum of a field such as Story Points, Effort, or Size.
- Show non-working days: Displays nonworking days as gray bars. For more information, see Set sprint capacity.
Select Reset to return to the default options. Changes to date controls don't change sprint date definitions.
Hover over any point on the chart to see a summary for that day.

The chart shows different data depending on your Burndown on selection:
The blue area shows the sum of Remaining Work per day for active or in-progress tasks. The Scope line shows Remaining Work added after the sprint started. The Ideal line shows the ideal burndown rate. Capacity lines appear only when the team configured capacity.


Note
Available sum fields depend on the numeric fields defined for task and requirement work item types. The most common fields are Story Points, Effort, or Size and Remaining Work.
Your selections persist across sessions until you change them.
Add the report to a dashboard
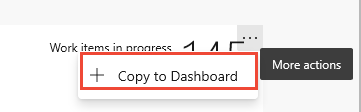
To add the in-context report to a dashboard, select the ![]() actions icon and select Copy to Dashboard. Then, select the target dashboard.
actions icon and select Copy to Dashboard. Then, select the target dashboard.
Add and configure the Sprint Burndown widget
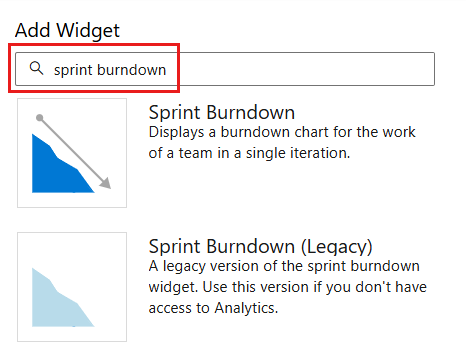
Add the Sprint Burndown widget to your dashboard. Filter the Add Widget dialog by sprint burndown to locate the widget.
Select the
 actions icon on the widget and select Configure.
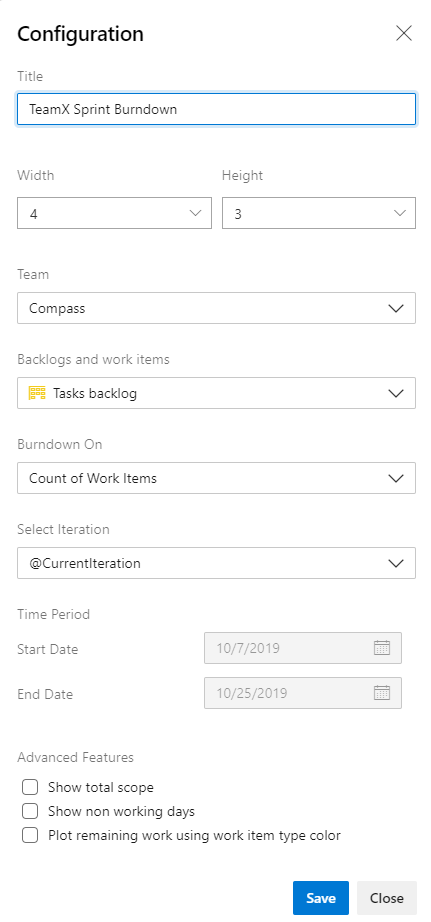
Configure the following settings:
Setting Description Title Modify the widget title. Size Select your preferred size (up to 10x10). Team Select the team to track. Backlogs and work items Select any backlog level or a specific work item type. Burndown on Choose Count of work items or a sum based on a selected field. Select iteration Choose @CurrentIteration or a specific iteration. Time period For @CurrentIteration, dates are set automatically. For a specific iteration, customize the start and end dates. Select advanced features to add to your chart:
Option Description Show total scope Displays historical and projected scope increase. Show non working days Shades nonworking days on the burndown. Plot remaining using work item type color Colors remaining work by work item type instead of default blue. Stacks colors for multiple work item types. Select Save.
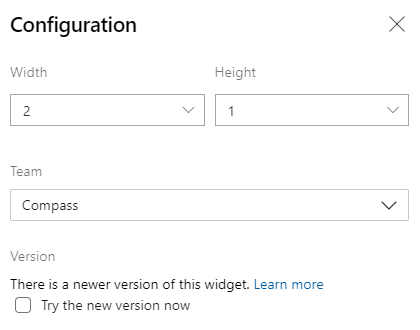
Sprint Burndown (Legacy) widget
The Sprint Burndown (Legacy) widget charts remaining work based on Remaining Work for tasks in a team's current sprint. Use this version when you don't have access to Analytics.

To configure the widget, select the ![]() actions icon and select Configure. Configuration options include team selection and widget size.
actions icon and select Configure. Configuration options include team selection and widget size.
Tip
To upgrade an existing legacy widget, select Try the new version now in the configuration dialog. You can switch back at any time.
Review past sprint burndown charts
As you complete each sprint, the system keeps a history of your activity. To view a past sprint's burndown chart, select it from the sprint selector.
When you review past burndown charts during retrospectives, you can identify patterns in your team's execution. Consider these questions:
- How does your projected velocity match up to your actual velocity?
- How can you more accurately determine how much your team can accomplish in a sprint?
- How can you complete work at a more regular pace throughout the sprint?


Best practices for sprint burndown
- Define tasks that take a day or less to complete to reduce the impact of poor estimates.
- Don't divide tasks into subtasks. If you do, specify hours only for the subtasks – hours roll up as summary values for the parent task.
- Update Remaining Work daily or several times a week to achieve a smoother burndown chart.
- At the end of each sprint, update the status of completed tasks and determine how to handle incomplete tasks.
Troubleshoot an empty burndown chart
If your sprint burndown chart appears empty, check these points:
- Are tasks assigned to the sprint associated with the chart?
- Is Remaining Work assigned to the tasks?
- Are the parent work items assigned to the same sprint? If not, tasks might appear in another sprint associated with the parent item.
Use AI to monitor sprint burndown
If you configure the Azure DevOps MCP Server, you can use AI assistants to help configure and interpret sprint burndown charts.
Example prompts
| Task | Example prompt |
|---|---|
| View the report | Open the in-context sprint burndown report for <team> in <project> (<organization>) and explain what I'm seeing |
| Configure the widget | Help me set up a Sprint Burndown widget on the <dashboard> dashboard for <team> in <project> (<organization>) that burns down Remaining Work |
| Troubleshoot an empty chart | My sprint burndown chart is empty for <team> in <project> (<organization>) — walk me through what to check (iterations, tasks, Remaining Work, and parent items) |
| Track by story points | Help me configure sprint burndown by Story Points for <team> in <project> (<organization>) and explain any prerequisites |
| Interpret a flat burndown | In sprint <sprint-name>, our burndown is flat for the first <n> days — what does that usually indicate, and what should <team> do next? |
| Identify scope changes | In the sprint burndown for <team> in <project> (<organization>), how do I tell whether scope was added mid-sprint and when it happened? |
| Compare report vs widget | What's the difference between the in-context Burndown Trend report and the Sprint Burndown widget in Azure DevOps, and when should <team> use each? |
| Compare sprints | Compare the last <n> sprints for <team> in <project> (<organization>) using burndown patterns and summarize whether our estimation accuracy is improving |
| Prepare for a retrospective | Based on the last sprint burndown for <team> in <project> (<organization>), suggest 3 retrospective questions and 3 process improvements to discuss |
Tip
If you're using Visual Studio Code, agent mode is especially helpful for iterating on multistep analysis (for example, comparing burndown trends across multiple sprints and summarizing the takeaways).