Bemærk
Adgang til denne side kræver godkendelse. Du kan prøve at logge på eller ændre mapper.
Adgang til denne side kræver godkendelse. Du kan prøve at ændre mapper.
Applies to: ![]() SQL Server
SQL Server ![]() Azure SQL Database
Azure SQL Database ![]() Azure SQL Managed Instance
Azure SQL Managed Instance ![]() SQL database in Microsoft Fabric
SQL database in Microsoft Fabric
SQL Server Management Studio provides the ability to view the live execution plan of an active query. This live query plan provides real-time insights into the query execution process as the controls flow from one query plan operator to another. The live query plan displays the overall query progress and operator-level run-time execution statistics such as the number of rows produced, elapsed time, operator progress, and more.
Because you can access this data in real time without needing to wait for the query to complete, these execution statistics are extremely useful for debugging query performance problems.
Internally, live query statistics use the sys.dm_exec_query_profiles DMV.
Warning
This feature is primarily intended for troubleshooting purposes. Using this feature can moderately slow the overall query performance, especially in SQL Server 2014 (12.x). For more information, see Query Profiling Infrastructure.
You can use this feature with the Transact-SQL debugger.
View live query statistics for one query
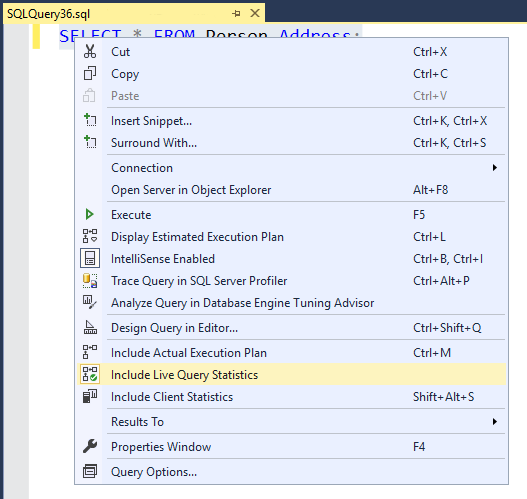
To view the live query execution plan, on the tools menu, select the Include Live Query Statistics icon.
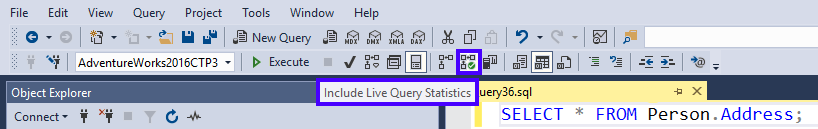
You can also access the live query execution plan by right-clicking on a selected query in Management Studio and then selecting Include Live Query Statistics.
Execute the query. The live query plan displays the overall query progress and the run-time execution statistics (for example, elapsed time or progress) for the query plan operators. The query progress information and execution statistics are periodically updated while query execution is in progress. Use this information to understand the overall query execution process and to debug long running queries, queries that run indefinitely, queries that cause
tempdboverflow, and timeouts.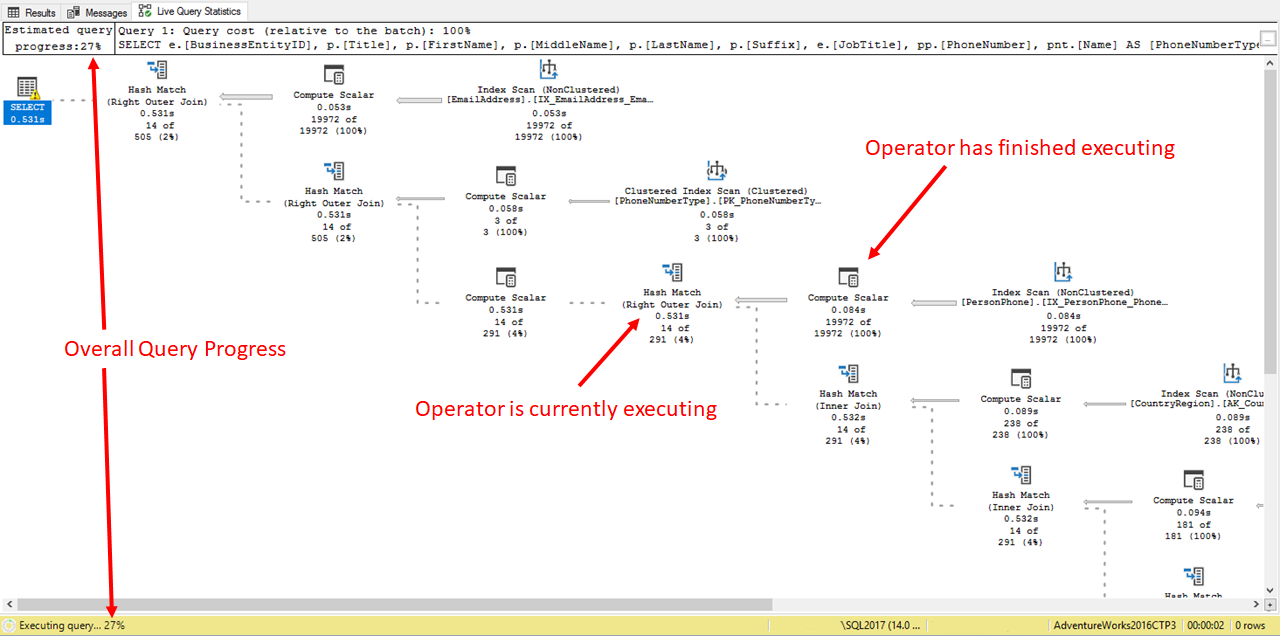


View live query statistics for any query
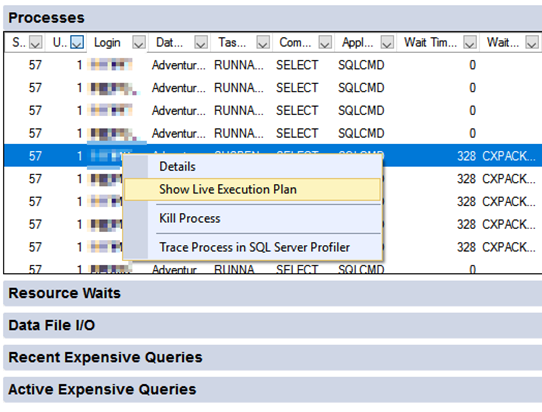
You can also access the live execution plan from Activity Monitor by right-clicking any query in the Processes or Active Expensive Queries table.
Remarks
You must enable the statistics profile infrastructure before live query statistics can capture information about the progress of queries. Depending on the version, the overhead can be significant. For more information about this overhead, see Query Profiling Infrastructure.
Permissions
- To populate the Live Query Statistics results page, you need the database level
SHOWPLANpermission, and any permissions necessary to execute the query. - On SQL Server, you need the server level
VIEW SERVER STATEpermission to see the live statistics. - On SQL Database Premium Tiers, you need the
VIEW DATABASE STATEpermission in the database to see the live statistics. On SQL Database Standard and Basic Tiers, you need the Server admin or Microsoft Entra admin account to see the live statistics.
Note
Microsoft Entra ID was previously known as Azure Active Directory (Azure AD).
Related content
- Execution plan overview
- Query processing architecture guide
- Monitor and Tune for Performance
- Performance monitoring and tuning tools
- Open Activity Monitor in SQL Server Management Studio (SSMS)
- Activity Monitor
- Monitor performance by using the Query Store
- sys.dm_exec_query_statistics_xml
- sys.dm_exec_query_profiles
- Logical and physical showplan operator reference
- Query Profiling Infrastructure